IJCRR - 7(11), June, 2015
Pages: 26-32
Print Article
Download XML Download PDF
DECLINING CHILD SEX RATIO IN INDIA AND ITS MAJOR CORRELATES
Author: Kalosona Paul, Shrestha Saha
Category: Healthcare
Abstract:Over all sex ratio (OSR) in India has enlarged from the last census (2001) by seven points from 933 to 940, the situation is worse for the child sex ratio (CSR). According to the decadal Indian census, the sex ratio in the 0-6 age group went down from 962 girls per 1000 boys in 1981, to 914 girls per 1000 boys in 2011. 2011 census showed that in 26 States/UTs rural child sex ratio are higher than urban areas. The paper intends to explain variability of CSR across the country through superimposed socio cultural frame. The analysis is based on CSR provided by Census of India for various decades. The study has focussed on various factors
covering wide range of socio-economic and demographic dimension that can be associated with contemporary sex discrimination and clarified their relative explanatory power. A total 230 districts has been analyzed from 7 states which have their CSR below national average(914). The spatial dimension of discrimination obtainable above leads to conclusions that sex ratio is more skewed in the most urbanized and economically well off states of north and western region.
Keywords: Child sex ratio (CSR), Sex discrimination, Socio cultural frame
Full Text:
INTRODUCTION
India has witnessed declining overall sex ratio since the last century. Females always have some biological advantage to survive longer than male in the absence of gender discrimination. Although the overall sex ratio (OSR) in India has increased from the last census (2001) by seven percentage points from 933 to 940, the situation is worse for the child sex ratio (defined as the ratio of girls to boys in the 0-6 year’s category). According to the decennial Indian census, the sex ratio in the 0-6 age group in India went from 962 girls per 1000 boys in 1981, to 914 girls per 1000 boys in 2011. 2011 census showed that in 26 States/UTs rural child sex ratio are higher than urban areas .9 States/UTs CSRs are higher in urban areas compared to rural areas. They are NCT Delhi, Chandigarh, Pondicherry Punjab, Maharashtra, Andhra Pradesh and Tamil Nadu, Mizoram and Manipur. Three fourth districts (461) in India have shown declining CSR in 2001- 2011. There have been has been more than 50 points decline in 38 districts and 51 districts increase has been 20 points. South Asian countries and India are societies with extreme demographic diversities and characterised by strong patriarchal norms which leads to the gender discrimination and strong son preferences. The issues pertaining to skewed child sex ratios are complex and multi-various. Declining child sex ratio in India is a long back issue and has been approached through various literatures. A major literature has emphasized on the unconventionality with prevailing culture demands as a pre requisite in devaluing girl child despite of the fact that such valuation has hooked up with other qualities like educational level, occupation, survival status and nutrition. Daughter discrimination in India is majorly found by depriving daughters mainly from food, medication and parental affection. Negligence towards girl child are much higher for those who born in higher parity and having elder sisters. Prevalence of infanticide in certain part of India and among certain communities definitely proclaims the unmet need for sex detection. Major studies have focussed on the cultural commonalities and contrast across regions and traditional north south division indicating differential position of women in society, which leads to the differential behaviour towards girl child and excess girl child mortality as a consequence of it (Sen 1990). The traditional excess girl child mortality displays a consistent connection with patriarchal social norms forming a core aspect of regional inequalities. The child sex ratio (0-6 years) is declining steadily during the last five decades and more steeply in northern states of India. In this context, this study aims to examine district wise child sex ratio and sex ratio at birth and study socio economic variations in child sex ratio focusing on Uttar Pradesh, Punjab, Haryana, Rajasthan and Himachal Pradesh, Maharashtra and Rajasthan the states with child sex ratios lower than the national average (914).
REVIEW OF LITERATURE
The major components of imbalances in overall and child sex ratio include (a) sex ratio at birth (b) sex differentials in mortality, (c) sex differential in migration and (d) under enumeration of women and girls. Sex ratio varies by region, by social group, age group and level of prosperity. The latest census in 2011 has recorded a significant decrease in the sex ratio of children age 0-6 while registering a marginal rise in the overall female-male ratio at from the earlier census in 1991. Many researchers attributed the decline in the child sex ratio to a possible rise in the sex ratio at birth owing to the increasing incidence of sex selective abortion (e.g. as Gupta and Bhat, 1997, Sudha and Rajan, 1999). The decline child sex ratio is both due to discrimination of female child at the age of 1-4 and sex selective abortion practices which is widely prevalent in Punjab, Haryana and Himachal Pradesh. Sex differentials in child mortality in ages 1-5 indicate a huge excess mortality for girls as the result of discriminations against female children in terms of food, nutrition and health care. Historically low sex ratio in India is mainly attributed to excess female child mortality (Visaria, 1971). However, the accelerated fall in the child sex ratio after 1981 is largely due to the diffusion of parental sex selection techniques in regions with well-entrenched gender bias (Bhat, 2002). Arnold, Kishore and Roy (2002), using NFHS- II data, found evidence of sex selective abortion based on data on use of ultrasound or amniocentesis in India. Biologically sex ratio at birth is always in favour of males, with about 105 boys per 100 girls. A statistical study of registered births in 75 territories with a relatively complete vital registration has confirmed the widely held belief that the masculinity ratio at birth varies generally between 104 and 107 (Male and Female). Sex ratio at birth greater than 107 may suggest evidence of sex selective abortion. Previous studies also indicated that in India sex-selective abortion is higher among urban women, middle and higher educated women and women living in households with high standard of living (Retherford and Roy, 2003 and Arokiasamy, 2004). In this context, although this study is inspired from the worrying facts of continuously strengthening tendency towards discrimination against women through integration of prevailing traditional gender biased norms and modern technology.
Objectives
• To study the pattern of district level child sex ratio (0-6 year age).
• To show the association of Child Sex Ratio (CSR) with various socio cultural and demographic variables
. • To study the effect of socio economic factors on the pattern of child sex ratio.
Data and methodology
• The district level data on child sex ratio (0-6 years)and socio economic indicators has been taken from 2001 and 2011 census
• The infant mortality rate and child mortality rate at district level has been taken from the report of ‘ Infant and child mortality in India district level estimates” population foundation of India 2008
• District level TFR and sex ratio at birth (SRB) has been taken from the published paper “District Level Fertility Estimates for Hindus and Muslims” by S irudaya Rajan, Economic and Political Weekly January 29, 2005 and
• “District-Level Estimates of Fertility and Implied Sex Ratio at Birth in India” by Sanjay Kumar, K M Sathyanarayana, Economic and Political Weekly august 18, 2012 vol xlviI no 33.
• The child sex ratio was calculated at the district level as the number of females per 1000 males of 0-6 age group following the definition of Indian census
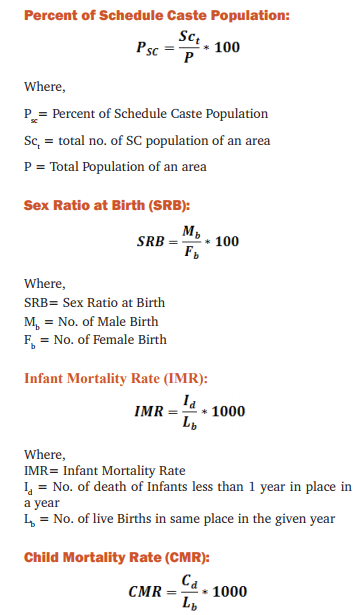
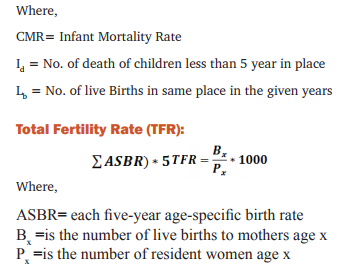
• Socio cultural variables like has been taken and they have been correlated with CSR to show the association. the variables are
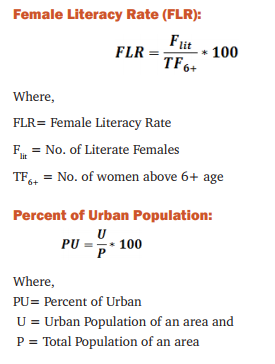
Female Literacy Rate (FLR):
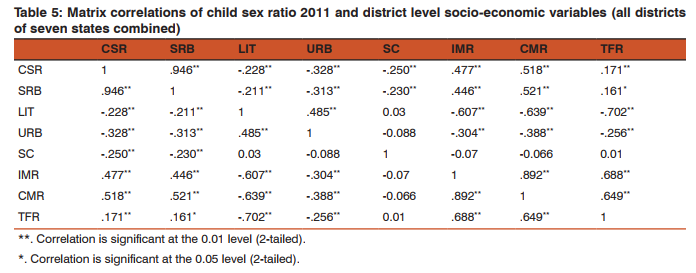
Matrix Correlation:
Correlation Matrix is one kind of diagonal matrix which has provide the association between entire pairs of dependent and independent variables.
RESULT AND DISCUSSION
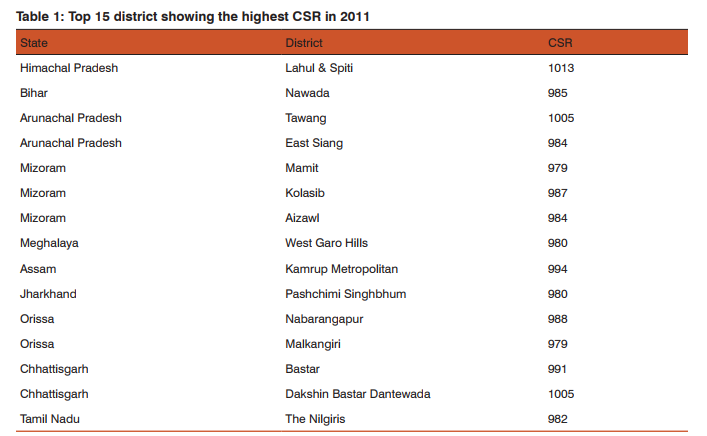
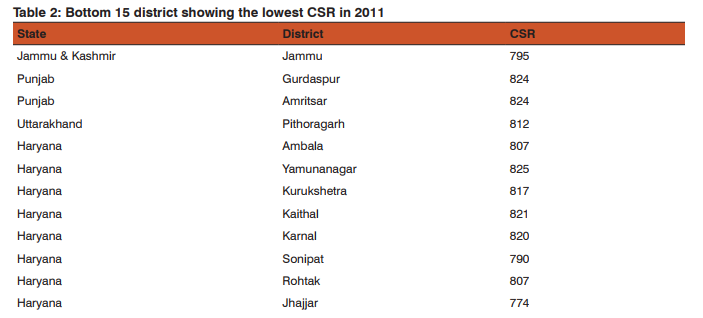
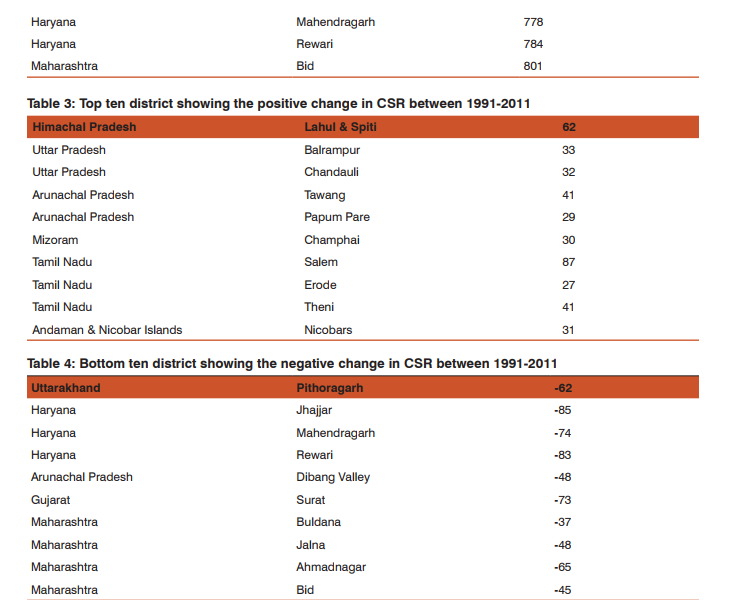
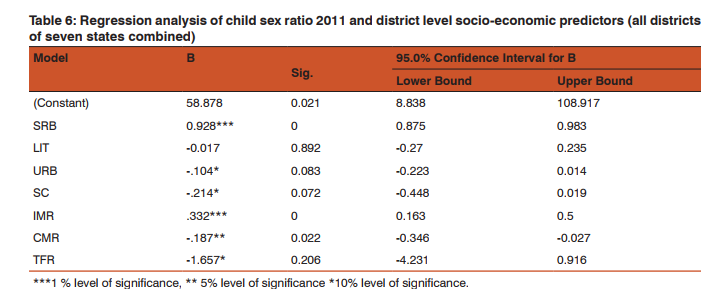
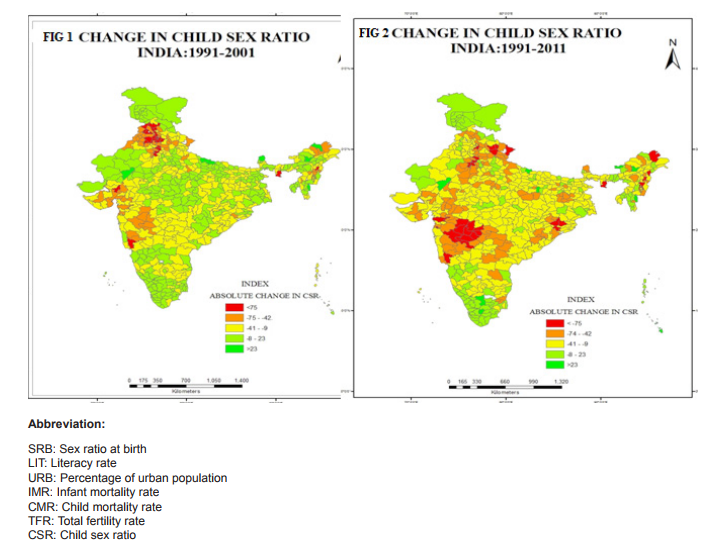
On the basis of the Child sex ratio the highest sex ratio is found in 2011 is Lahul and spiti district in Himachal Pradesh. It shows a very sharp distinction from other district in terms of child sex ratio although the overall CSR in Himachal Pradesh is below national average but the district having highest CSR located in that very state. Tawang district in Arunachal has the second highest child sex ratio of 1005 the district namely Dakshin baster dantewada also in Chhattisgarh also has as high CSR as Tawang. Kamrup Metropolitan in Assam has CSR of 994 State of nabarangapur in Orissa has CSR of 988 followed by Kolasib in Mizoram 987, Nawda in Bihar 985 Aizwal 984 Malkangiri in Orissa has the CSR of 979 (Table 1). District having lowest Child sex raio is found in Jhajjar of Haryana 774, Mahendragarh of same state having CSR of 778 and Rewari 784, Sonipat 790 of same state. In the district of Jammu CSR is 795 followed by Ambla in Haryana. Among15 lowest CSR districts in India 10 belong from Haryana (Table 2). The difference has been calculated to show the changes in child sex ratio between 1991 and 2011. The above table has been made on the basis of the 10 district who have the highest positive changes in improving CSR in twenty years of time period. Positive change in child se ratio is highest in Salem in Tamil Nadu which is 87 point change from 1991 to 2011 followed by Lahul Spiti in Himachal Pradesh by 62 points, Theni in Tamil Nadu and Tawang in Arunachal Pradesh have change of 41 points followed by Balarampr (33) in Uttar Pradesh, chandauli (32) champali (30 ) in Mizoram (Table 3). There also negative changes in many districts highest negative changes in 2011 CSR is found by 85 points since 1991 of district Jhajjar in Haryana, followed by Rewari 83 points, Mahendranagar 74 points of same state (Fig 1and 2). Ahmdanagar in Maharashtra has decreased by 65 points in CSR since 1991 Pithoragarh by 62 points (Table 4). The correlation has been done for each selected state with their various socio-cultural and demographic variables of those states which have the child sex ratio over national average (914). All total 230 district has been taken of states Uttar Pradesh, Madhya Pradesh, Maharashtra, Rajasthan, Punjab, Haryana, Himachal Pradesh The result shows that the influence of independent variables on dependent variable are not similar one independent variable for a particular state may act positively on the dependent and for other state it may act negatively or may show no strong relationship. No independent variable for all selected states has influenced as strongly as sex ratio at birth. Sex ratio at birth (SRB) for each state has influenced CSR very strongly. It makes the point clear that excess female child mortality starts in pre natal stage of life rather than post natal stages. Thus study of sex ratio at birth has became inescapable while studying child sex ratio specially for those states which are economically well off urbanised and have strong history of patriarchy. Where the SRB is greater than CSR post natal child mortality seems to be higher and vice versa. Literacy and urbanisation are negatively correlated with child sex ratio. Means on increasing literacy and accessibility of innovative technology of urban females the sex ratio is decreasing, which is a very shocking situation. Although with increase of literacy and urbanisation over all TFR and infant child mortality is negatively correlated thus one can assume that improvement with literacy and urbanisation there will be social progress and the child sex ratio will improve but the case is just reverse in India (Table 5). Multiple linear regression analysis has shown the influence of socio economic variable on child sex ratio. The result shows that sex ratio at birth are statistically significant and has positive effect on child sex ratio. Total fertility rate and infant mortality rate shows negative and positive influence on child sex ratio respectively .statistical evidences suggests percentage of urban population influence negatively on child sex ratio (CSR). Schedule caste population influence negatively on child sex ratio (Table 6).
CONCLUSION
The spatial dimension of discrimination presented above leads to conclusions that sex ratio is more skewed in the most urbanized and economically well off states of north and western region. Conversely, the relative under developed and less urbanized population of central and eastern region have higher child sex ratio. Many of the factors associated with gender bias in India discussed previously more in the context of north south cultural contrast (Dyson and Moore 1983). The maps show obvious regional contrast but it also indicates a strong level of geographical continuity. Thus geography of CSR variations remain as an issue of discussion through the superimposed socio cultural frames that really deserves attention. The district level CSR from census 2011 has been analyzed. Historically Indian CSR has always been skewed in North western India. Literature on CSR pointed out a clear division between North West and South east pattern of female survival disadvantage. The reasons of child masculinity in north western states have been explained by the cultural practice and kinship structure which attaches lesser utility to female children than male children and produces social norms hostile for the survival of a girl child.
References:
1. Agnihotri, S.B., 2000, “Sex Ratio Patterns in the Indian Population: A Fresh Exploration.” New Delhi: Sage Publications.
2. Arokiasamy, P. 2004, “Regional patterns of sex bias and excess female child mortality in India”. Population Studies, 59 (6), pp 833-864.
3. Arnold, F., Kishor, S. and Roy, T. K. (2002) Sex-Selective Abortions in India, Population and Development Review. 28(4). p. 759-785 .
4. Bhatt. Mari P.N., 2002, “On the Trail of “Missing” Indian Females (I).” Economic and Political Weekly, 37(51 and 52), 5108-118.
5. Dyson, T. and Moore,M. 1983, “On Kinship Structure, Female Autonomy, and Demographic Behavior in India”. Population and Development Review Vol. 9, No. 1 pp. 35-60.
6. Das Gupta, M., 1987, ‘Selective Discrimination Against Female Children in Punjab, India’, Population and Development Review, Vol. 13, No.1, pp.77-100.
7. Das Gupta, Monica and Bhat, P.N. Mari 1997, “Fertility decline and increased manifestation of sex bias in India.” Population studies, 51(3). 307-315.
8. Guilmoto, C.Z. and S.Irudaya Rajan 2002, “District level Estimates of fertility from India’s 2001 census” Economic and political weekly, feb.2002 (672).
9. Gulliot, Michel. 2002, “The dynamics of population sex ratio in India, 1971-96” Population studies, 56(2002), 51-63, printed in Great Britain.
10. Krishnaji, N.1987. “Poverty and Sex Ratio: Some Data and Speculations.” Economic and Political Weekly, Vol. XXII, No 23, 892- 897.
11. Sanjay Kumar, K M Sathyanarayana 2012, District-Level Estimates of Fertility and Implied Sex Ratio at Birth in India, Economic and Political Weekly august 18, 2012, vol xlviI no 33. ‘Infant and child mortality in India district level estimates” population foundation of India 2012.
12. Sekher, T.V. and Neelambar Hatti., 2006, “Vulnerable Daughters in a Modernizing Society.” Lund papers in Economic History. No.104, Lund, Sweden: Lund University.
13. Sen, Amartya, 1990, ‘More than 100 Million Women are Missing,’ New York Review of Books, 20 December, 61-66
14. Visaria, Praveen M. 1967, “Sex Ratio at Birth in Territories with a relatively complete Registration.” Eugenics Quarterly, Vol. 14, No. 2(pp. 132-142).
|
 IJCRR
IJCRR 


 This work is licensed under a Creative Commons Attribution-NonCommercial 4.0 International License