IJCRR - 4(16), August, 2012
Pages: 47-61
Date of Publication: 28-Aug-2012
Print Article
Download XML Download PDF
GEOINFORMATICS APPROACH TO QUALITATIVE FOREST DENSITY LOSS ESTIMATION AND PROTECTION CUM CONSERVATION STRATEGY- A CASE STUDY OF PIR PANJAL RANGE, J & K, INDIA
Author: Gowhar Meraj, Shakil A. Romshoo, A.R. Yousuf
Category: General Sciences
Abstract:The present work is an attempt to qualitatively assess forest density losses very rapidly over a comparatively large area. This study unravels the forest density loss rates of forest compartments in district budgam, central Kashmir between 1992 and 2008, wherein forest compartments are grouped based on the emergency of forest conservation required. Satellite remote sensing and GIS technology has been used in this study for land use/land cover inventorization. Methodology consisted of using visual image interpretation and vector GIS overlay analysis. The data sets used were Landsat TM-1992 and IRS-LISS III-2008. Forest density classification was performed using Forest survey of India (FSI) classification scheme. In order to analyze forest density losses within forest compartments, vector GIS overlay analysis of forest class theme-1992, forest class theme-2008 and forest compartment boundary was performed. The resultant overlaid theme was analyzed for forest density change between 1992 and 2008.The highest percent forest density loss was observed in Danizar (90.60%) followed by Nilnag (90.24%), Sangarwain (87.48%), Nagabal (81.24%), Doodhganga (69.04%), Yus (41.55%), Guravet (27.17% ), Brenwar (25.70%), Kachwari (23.05%), Handpathar (15.36%), and Nambian (1.13%).On the basis of percent forest density loss status of forest compartments a protective cum conservative prioritization grouping was performed wherein those compartments which have degraded more than 30 % were grouped into highest priority status compartments. As for as the immediateness of the protection cum conservation is required, it was concluded that Yus, Doodhganga, Nagabal, Sangarwain, Nilnag and Danizar fall in the highest priority group while as Nambian, Handpathar, Kachwari, Brenwar and Guravet fall in the least priority group. This study provides a methodology to quickly assess forest density loss rates and an effective approach for forest conservation and protection strategy using satellite remote sensing and GIS technology.
Keywords: Forest Density Class, Vector GIS overlay analysis, Forest Conservation, Forest compartment, Pir Panjal Range, Protective cum Conservative Prioritization Grouping.
Full Text:
INTRODUCTION
Jammu and Kashmir is has been endowed with Nature’s most treasured resources. Gushing waterfalls, magnificent flora and fauna, majestic mountains and water not. Kashmir is well known as a place of bliss and delight and peace. One of the reasons for Kashmir’s such grandeur can be imparted to its rich treasure of forest resources. The total land under forests in J and K is 2,023,000 Km2 (J and K, Forest Digest-2005; J and K Digest of Statistics (DES), 2005) which comprises about 10% of its geographical area.
Forests are among those natural resources which intertwine the web of life and are thus subservient to overall livelihood. Fuel wood, fodder, soil erosion check and improvement, etc. are some of the functions of forests. However the services forests provide are under threat to these services of the forests is the deforestation. It has several potential impacts on the climate through biogeochemical cycles, particularly via atmospheric component of the carbon cycle i.e., CO2 concentration in the atmosphere. It is estimated that each year about 2 Gt C is released to the atmosphere as a result of tropical deforestation (Gornitz, V. 1987). Deforestation in tropics is considered as one of the major cause of global climate change. In Brazil alone, 1.5 million ha had been deforested in 1978, increasing to 4.26 million ha in 1991 (Frohn et al., 1996). Moreover, deforestation has tremendous ecological, hydrological, and geomorphological impacts on Earth system (Baumler, R and Zech, W. 1999; Goudie, A. S. 2000; Lal, R. 1999). Deforestation and forest degradation although synonymous in terms of consequences they manifest, are two different anthropogenic impacts on the forests. Forest degradation is a process leading to a ‘temporary statistically representative data on land-cover change or permanent deterioration in the density, structure of vegetation cover or its species composition (Grainger, 1993). The first one is the total clearance of trees in the forested land while as the latter is the deterioration of the quality of forests in terms of density, health, genetic diversity and age profile degradation. Tropical forests are suffering the greatest current losses in forest area and quality; however temperate forests have been affected more than other forest types by fragmentation and disturbance (Echeverria C. et al., 2006). In temperate zones, such as the study area of the present work although deforestation has been controlled to a large extent but cutting up of trees within the dense forest resulting in the degradation of forest density has been going on unprecedented. Estimations of the forest density degradation is therefore one of the most important tasks in the restoration of quality of forests. The present work has been carried out in the temperate climatic regime of lesser Himalayas- a pilot study area of the Pir-Panjal range and forest degradation in terms of density losses has been evaluated using remote sensing and GIS. The approach adopted in the present study is to evaluate forest degradation status of the forest compartments and emphasis has been laid upon using forest compartment as unit of conservation. Since a forest compartment is a permanent, geographically recognizable unit of forest land forming the basis for planning, prescription, implementation, monitoring and recording of forest operations (FAO, 1996). It can be best used as a unit of forest conservation.
MATERIALS AND METHODS.
Study Site
The Pir Panjal is the main barrier between the plains of India and the Kashmir valley. A pilot study area comprising of 13 forest compartments was chosen for this study. An important meadow Yusmarg falls in this area which is well known tourist spot. This study area falls in the district Budgam, Jammu and Kashmir, India. It falls in a forest compartment called yus which is among other 13 forest compartments associated with two forest ranges-Doodhganga and Raithan in the study area (Figure 1). The study area lies between lies between longitude 74o 27’ 7.9’’ – 74o 45’37.9’’ E and latitude 33o 42’16.67’’N – 33o 52’57.75’’ N. Height in this area is generally between 1600 to 2100 meters above sea level. The study area supports a varied topography. From southwest to northeast the area consists of lofty Pir Panjal, and flat topped Karewa as foothills and plains. The slopes of this range are gentle. The Pir Panjal mountain range covers the Kashmir valley on the south and southwest, separating the Kashmir valley from the Chenab valley and Jammu region (Raza et al., 1978). The present work is an attempt to put forward a methodology to qualitatively assess the forest density losses very rapidly over a comparatively large area using remote sensing and Geographic Information System (GIS) technologies and to give legislators efficient and logical information about how to stop forest degradation effectively. Although there are sophisticated approaches to quantify forest density using remote sensing and GIS techniques(Jamalabad M. S. et al., 2002; Azizia Z. et al., 2002; Han Liu et al., 2011) but the approach used in this study is less scholarly and at the same time efficient enough to arrive at the forest protection policies. The current study is an assessment of the forest degradation rates within forest compartments of a pilot study area of Pir Panjal mountain range. Methodology adopted includes visual image interpretation and vector GIS analysis.
Datasets, Software and Tools
a. IRS-1D LISS III of 21-October-2008 (Figure 2)
b. LANDSAT-TM of 24-October-1992 (Figure 3)
c. Forest working plans provided by Jammu and Kashmir state forest department and territorial boundary by Survey of India (SOI). The overall methodology is represented in (Figure 4)
Datasets used were first preprocessed for radiometric and geometric corrections. IRS-1D LISS III has spatial resolution of 23.5 m and sense radiations in near infrared (NIR), red, green and blue, the wavelengths are enlisted in the table. LANDSAT-TM has spatial resolution of 30 m and senses radiations in seven bands. High spatial resolution near infrared band (NIR) is the primary band for vegetation analysis using remote sensing techniques. The software utilized were Arc INFO/ ArcGIS 9.3 and Erdas Imagine 9.1. For ground truthing GARMIN GPS Map 76CS Global Positioning System (GPS) was used. Also classification was aided by high spatial resolution images from Google Earth. It is one of the best tools for evaluation of visual image interpretation results.
Visual Image Interpretation and Vector GIS Analysis
Visual image interpretation approach of land use / land cover classification uses on-screen digitization technique to classify different land surface features on the basis of tone, texture, pattern, shadow, association etc (Lillesand T. M. and Kiefer R. W. 1987, Jensen. J. 1996). It has been demonstrated that this technique in accuracy is similar to the digital classification methods when applied to medium and low resolution satellite images (Puig C. J. et al., 2002). Forest Survey of India classification (FSI) scheme was used to delineate forest density classes (Table 1) (FSI, 2001).The classified area was then overlaid by forest compartment boundary to evaluate forest degradation between 1992 and 2008 within the forest compartments (FAO, 1996). The results were then used to assign protection cum conservation prioritization grouping for indicating the emergency of conservation required. The vector GIS overlay analysis combines the geographic features and attributes tables of both inputs into a single new output. In this study union overlay tool was used. After union operator data is applied data is extracted using a "clip" or "mask" to take out the features of one data set that fall within the spatial extent of another dataset (Burrough P. A. 1986).
Forest Density Degradation Indices
The most important aspect of this study is the evaluation of the forest degradation through following degradation indices. (FDDg = ΔVDF + ΔMDF + ΔOF)C16……..1 (%FDDg) = FDDg/TF_ 1992) C16………….2 FDDg stands for forest density degradation and represents the change in the land area under different forest density classes. Subscript C16 represents sixteen year change in the forest compartment between 1992 and 2008. Negative Δ values indicate that the land under particular forest class has increased. However while evaluating FDDg negative signs were neglected so as to provide total change in area under different forest density classes. This forms the basis for evaluating forest density degradation between 1992 and 2008. Forest degradation indices are represented by the equations 1 and 2. Equation 1 gives the forest degradation in terms of hectares of forest land degraded and equation 2 gives percent degradation status of the forest compartment. Using equation 2 as the basis for immediate protection needed in a forest compartment to stop its degradation, those compartments which have been degraded more than 30 % between 1992 and 2008 were grouped into highly prioritized compartments. These empirical relationships are very much helpful in evaluation of the qualitative forest degradation status of the compartments.
RESULTS AND DISCUSSION
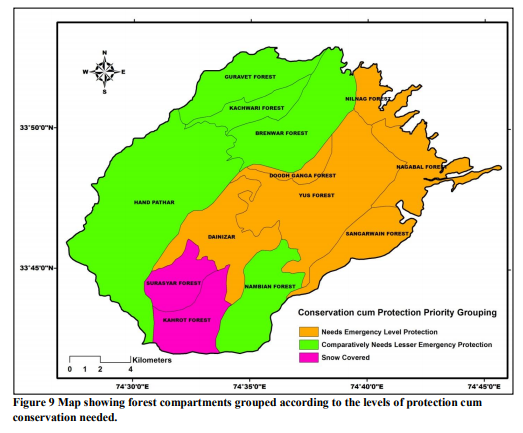
It was observed that Nambian forest compartment possessed the maximum land under forests followed by Yus Nagabal, Doodhganga, Brenwar, Sangarwain, Nilnag, Guravet, Kachwari, Handpathar, and Danizar in 1992 (Figure 5). The compartment wise distribution of different forest density classes in 1992 and 2008 (Table 2). It was observed that in almost all compartments, land moderately dense forests and open forests have increased indicated by the negative ΔMDF and ΔOF values (Table 3). This is attributed to the decrease in the land under very dense evergreen forests shown by positive Δ VDF values (Table 3; Figure 6). Forest density degradation index (FDDg) in terms of hectares of forest land degraded was found greatest in Nagabal followed by Sangarwain, Yus, Doodhganga, Brenwar, Guravet, Danizar, Kachwari, Handpathar, Nilnag and Nambian (Table 4) (Figure 7). However in terms of % FDDg Danizar (90.60%) has been degraded maximally and is closely followed by Nilnag (90.24%), Sangarwain (87.48%), Nagabal (81.24%), Doodhganga (69.04%), Yus (41.55%), Guravet (27.17%), Brenwar (25.70%), Kachwari (23.05%), Handpathar (15.36%), and Nambian (1.13%) (Table 3, Figure 8). More than 30 % of Nilnag, Sangarwain, Nagabal, Doodhganga, and Yus forest compartments have seen forest density degradation and therefore are grouped into highly prioritized forest compartments for immediate protection measures (Figure 9).
CONCLUSION
From this study it has been concluded that remote sensing and GIS technique can provide immediate forest conservation cum protection status of an area. The methodology used in this work in which forest density degradation has been qualitatively evaluated within a forest compartment is very efficient in providing government agencies a quick look about what is happening within a forest. Among the thirteen forest compartments, five have been severely degraded indicated by the greater than 30% decrease in their forest density from 1992 to 2008. If such degradation is not stopped, over the coming years whole forest area would be finally deforested.
AKNOWLEDGEMENTS
This works forms a part of the Master’s thesis in Environmental Science of the author. Authors acknowledge the immense help received from the scholars whose articles are cited and included in references of this manuscript. The authors are also grateful to authors / editors / publishers of all those articles, journals and books from where the literature for this article has been reviewed and discussed.
References:
1. Baumler, R and Zech, W. 1999: Effects of forest thinning on the stream chemistry of two forested watersheds in the Bavarian Alps. Forest ecology and management 116, 119-128
2. Burrough P A 1986 Principles of Geographic Information systems for land resources assessment. Oxford University Press UK
3. Cristian Echeverria David Coomes, Javier Salas, Jose Mar?a, Rey-Benayas, Antonio Lara, Adrian Newton. 2006: Rapid deforestation and fragmentation of Chilean Temperate Forests. Biological Conservation 130 (2006) 481–494
4. Digital Classification vs. Visual Interpretation, a case study in humid tropical forests of the Peruvian Amazon Carlos JavierPuig,Glenn Hymanand Sandra Bolaños; http://gisweb.ciat.cgiar.org/sig/download/gh yman/Puig2002DigitalVsVisual.pdf
5. FAO, 2000b. On Definitions of Forest and Forest Change. Forest Resources Assessment Programme Working Paper 33. FRA 2000
6. Forest canopy density estimating using, using satellite images, Z.azizia, A.Najafia, H.Sohrabia; www.isprs.org/proceedings/XXXVII/congre ss/8_pdf/11.../21.pdf
7. Forest canopy density monitoring, using satellite images, M. Saei jamalabad, A.A. Abkar; http://www.isprs.org/proceedings/xxxv/cong ress/comm7/papers/48.pdf 8. Forest Digest-2005 and Digest of Statistics (DES), Government of Jammu and Kashmir
9. Forest Survey of India (FSI) scheme of classification; http://www.fsi.org.in/scheme_of_classificati on.htm
10. Frohn, R. C., McGwire, K. C. Dale, V.H. Estes, and J.E. 1996: Using satellite remote sensing analysis to evaluate a socioeconomic and ecological model of deforestation in Rondonia, Brazil. International journal of Remote Sensing 17, 3233-3255.
11. Gornitz, v. 1987: Climatic consequences of anthropogenic vegetation changes from 1880-1980. In Rampino, M. R., Sanders, J.E., Newman, W.S. and Konigsson, L.K. (eds), Climatic: periodicity and predictability, New York: Van Nostrand Reinhold, 47-49
12. Goudie, A. S. 2000: The hum,an impact on the natural environment, 5th edition, Oxford: Blackwell
13. Grainger, A. (1993) Controlling tropical deforestation, p.310. Earthscan Publications Ltd, London
14. Han Liu et al., Journal of Machine Learning Research 12 (2011) 907-951
15. Jensen J 1996 Introduction to digital image processing: A remote sensing perspective (Ist ed.). Prentice Hall, New York, US
16. Lal, R. 1999: Deforestation effects on the soil degradation and rehabilitation in western Nigeria. 4. Hydrology and water quality. Land degradation and development 8, 95-126
17. Lillesand T M and Kiefer R W 1987 Remote Sensing and Image Interpretation. John Wiley and Sons, New York.
18. Moonis R, Aijazuddin A and Ali M 1975 The Valley of Kashmir: A Geographical Interpretation, Vikas publishing House New Delhi. P. 95-99


|
 IJCRR
IJCRR 


 This work is licensed under a Creative Commons Attribution-NonCommercial 4.0 International License