IJCRR - 9(9), May, 2017
Pages: 32-36
Date of Publication: 15-May-2017
Print Article
Download XML Download PDF
Diagnosing Inter Firm Profitability of Pharmaceutical Industry: An Empirical Analysis for India
Author: Abhinna Srivastava
Category: Technology
Abstract:Indian pharmaceutical industry ranks 3rd in the world in terms of volume, quality and range of medicines it manufactures. Cost of producing medicine in India is considerably lower than that of the USA and approximately half of that of European countries which confers a competitive edge to India over others. Current domestic market of Indian pharmaceutical industry is worth US$13.8 billion (PWC, 2013). There are hundreds of pharmaceutical companies in India so a comparative study of their profitability is always needed. Present study is an effort to give an insight into profitability measures of selected pharmaceutical companies in India. Top five pharmaceutical companies in India have been selected for study based on the size of their current market capitalization including Sun Pharmaceuticals, Lupin, Dr. Reddys Lab, Cipla and Aurobindo Pharma. Further in order to draw a conclusion, profitability ratios of these companies has been analyzed and ranked on the basis of their composite performance during the period of study i.e. FY 2012 to FY 2016. Present study shows Indian pharmaceutical companies are doing well on account of profitability measures; Lupin is far ahead of its competitors whereas Sun Pharma emerged as the least performer during the study period.
Keywords: Profitability, Sun Pharmaceuticals, Lupin, Dr. Reddys Lab, Cipla, Aurobindo Pharma, India
Full Text:
INTRODUCTION
Indian pharmaceutical sector plays a pivotal role in economy development. It contributes approximately 2.4% of the global pharmaceutical industry in terms of value and 10% in terms of volume. Pharmaceutical industry in India is expected to grow at a CAGR of 16% from US$ 20 billion in 2015 to US$ 55 billion by 2020. Indian drugs and medicines are currently exported to more than 200 countries worldwide. USA is the focal market for our pharmaceutical products. India is the largest producer of generic medicines in the world and it is expected to grow further in years to come. Government of India plans to set up a venture capital fund of US$ 640 million to facilitate drug discovery and reinforce pharmaceutical infrastructure in the country. The ‘Pharma Vision 2020’ by the Department of Pharmaceuticals, Government of India is determined to make India a hub for major drug discovery in the world. One of the important aspects with Indian pharmaceutical companies is its cost effective production, cost of producing medicine in India is considerably lower than that of the USA and approximately half of that of European countries which confers a competitive edge to India over others. Leading Pharmaceuticals companies in India on the basis of their market capitalization includes Sun Pharmaceuticals, Lupin, Dr. Reddys Lab, Cipla, Aurobindo Pharma etc.
OBJECTIVE OF THE STUDY
- To evaluate the performance of leading pharmaceutical companies in India in respect of their profitability.
- To scrutinize the profitability measures of these companies under the study;
- To make to a comparative analysis of the performance of these companies based on key profitability ratio; and
- To give an ultimate ranking to these companies on the basis of their profitability.
RESEARCH METHODOLOGY
For the purpose of study top five pharmaceutical companies in India have been selected on the basis of their market capitalization and listing on both the Indian stock exchanges; BSE & NSE.
The present study is based on secondary data, compiled from annual reports of these companies as published on their official website. Apart from it relevant data have been taken from the site of Indian stock exchanges; BSE, NSE, financial sites like Money control and Google finance. Various financial journals, magazines and report have also been used for the present study. Further data have been scrutinized with the help of MS word, Excel etc.
For the purpose of study data so obtained was analyzed by using ratio analysis of favorite profitability measures like Operating Profit Margin, Net profit Margin, Return on Equity, Return on Capital Employed and Return on Assets. An ultimate ranking was given to each company on individual performance at each profitability ratio.
The present study covers a period of five years i.e. FY’12 to FY’16.
Present study encompasses only top five pharmaceutical companies; Sun Pharmaceuticals, Lupin, Dr. Reddys Lab, Cipla and Aurobindo Pharma based on their current market capitalization. This paper concludes on a single parameter i.e. profitability measure.
DATA ANALYSIS
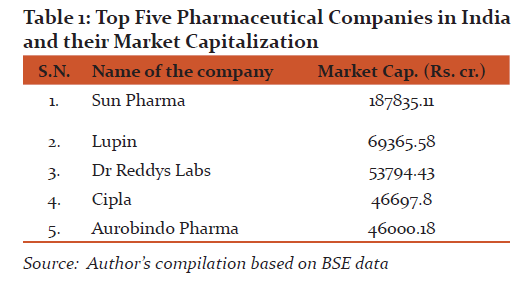
For the purpose of study a list of top five pharmaceutical companies has been categorized on the basis of their market capitalization as on 15th September, 2016. Table-1 exhibits top five IT companies in BSE and their market cap in Rs. Cr.
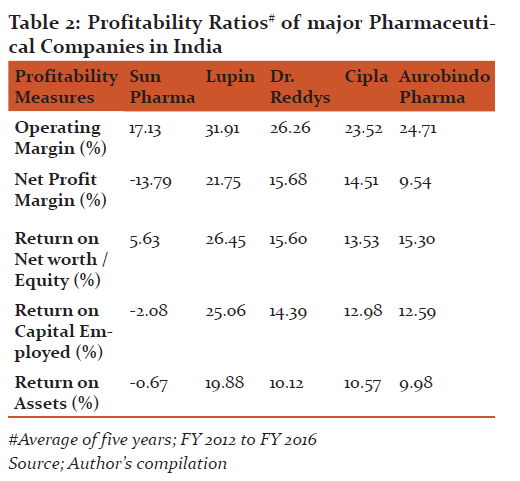
Based on five years average profitability measures a datasheet (Table-2) has been prepared for top five pharmaceutical companies. All the measure profitability ratios; Operating Margin, Net Profit Margin, Return on Net worth/Equity, Return on Capital Employed and Return on Assets were calculated further mean for five years FY’12 to FY’16 in term of percentage have been taken for the study.
1. Operating Margin:
Operating Profit Ratio constitutes the relationship between operating profit and net sales of the company. Operating Profit is also termed as PBIDT or EBIDTA; profit/earnings before interest, depreciation, tax and amortization. A higher operating margin ratio makes a company able to assure enough margins to cater its non-operating expenses. It also helps to create sufficient reserve to ensure payment of dividends.
Operating Profit Ratio is computed as follow;
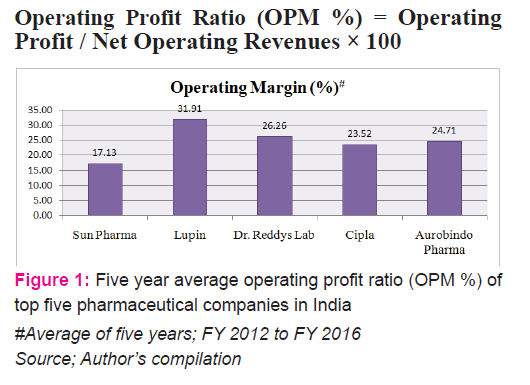
Figure-1 exhibits that Lupin maintains higher average operating margin at 31.91% in last five years; FY 2012 to FY 2016, followed by Dr. Reddys Lab (26.26 %), Aurobindo Pharma (24.71 %) and Cipla (23.52%). Sun Pharma is maintaining least operating margin at average 17.13 %.
2. Net Profit Margin:
Net Profit Ratio establishes the relationship between net profit and net sales of the company and shows managerial efficiency of the company in measure areas like manufacturing, administration and selling the product. Higher Net Profit margin shows a profitable position of the company which help them to endure in the case of increasing cost of production, deteriorating selling prices and declining demand for the product in the market. Net Profit Ratio is calculated as under:
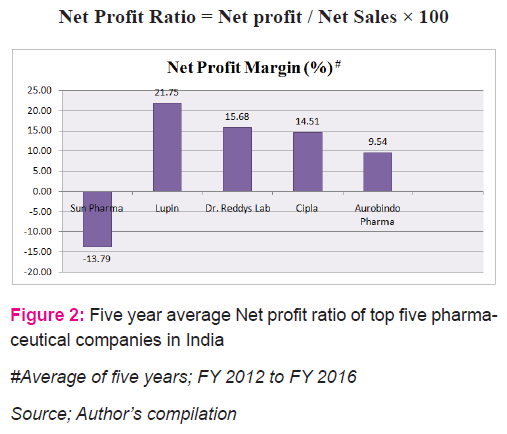
Figure-2 exhibits that Lupin maintains highest average Net Profit Margin at 21.75% in last five years; FY 2012 to FY 2016, followed by Dr. Reddys Lab (15.68%), Cipla (14.51%) and Aurobindo Pharma (9.54 %). Sun Pharma on the other hand has negative net profit margin at average -13.79 %.
Return on Equity:
For investors of the company Return on Equity (ROE) /Return on Net worth measures the return on the investment into the equity shares of the company, it is the most important profitability measure for an investor. The higher the Return on Equity ratio, the better it is supposed for the investors. ROE exhibits with some exceptions, firm capability of using investors' money in the most profitable manner. Return on Equity (ROE) computed as follow;
ROE = Net Profit / Shareholders Fund ×100
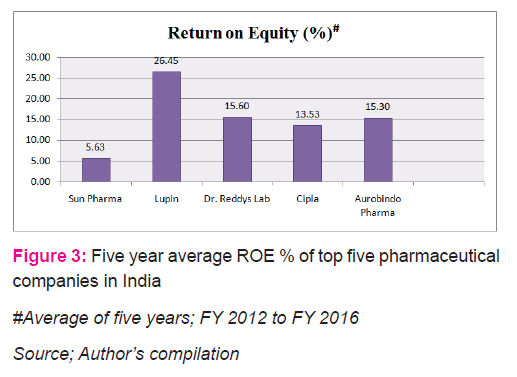
Figure-3 exhibits that Lupin is having highest average ROE at 26.45% in last five years; FY 2012 to FY 2016, followed by Dr. Reddys Lab (15.60%), Aurobindo Pharma (15.30%) and Cipla (13.53%) while Sun Pharma is the least performer with ROE of 5.63%.
4. Return on Capital Employed:
ROCE exhibits firm’s operational efficiency, it measures to what extend investors are getting return on the capital employed by them in the company. ROCE ratio is a performance measure which simply shows how much return is generated by the investors from their invested capital. The ROCE is computed as follow;
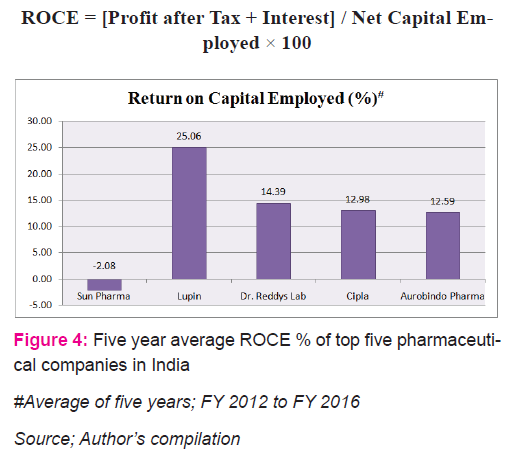
Figure-4 exhibits that Lupin maintains highest average ROCE at 25.06% in last five years; FY 2012 to FY 2016, followed by Dr. Reddys Lab (14.39%), Cipla (12.98%) and Aurobindo Pharma (12.59%). Sun Pharma is the least performer among all the companies having negative ROCE at average -2.08 %.
5. Return on assets (ROA)
Return on assets commonly known as ROA, ascertains the relationship between firm’s earning capacity and its long term assets. ROA reveals how beneficial a firm is towards its total long term assets and how efficiently the management is using its assets in order to breed maximum possible earnings. It is calculated as a percentage as follow;
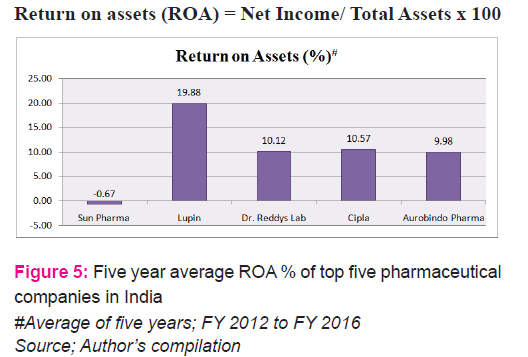
Figure-5 exhibits that Lupin maintains the highest ROA at average 19.88% in last five years; FY 2012 to FY 2016, followed by Cipla (10.57%), Dr. Reddys Lab (14.12%), and Aurobindo Pharma (9.98%). Sun Pharma even at ROA measure stood last with negative average of -0.67 %.
DISCUSSION:
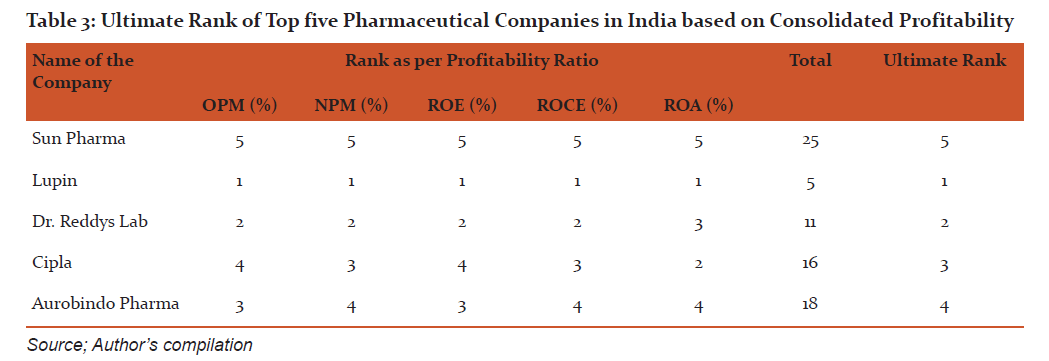
Table-3 shows consolidated profitability measures of top five pharmaceutical companies in India. As per profitability ratio, firstly individual rank has been given to each company based on isolated profitability measure then an ultimate rank to all the five companies on the basis of their individual profitability rank. Highest rank has been given to the company having minimum total value of individual ranking in each profitability measure.
FINDINGS:
1. It was found that Lupin among the top five pharmaceutical companies in India selected for the study is the top performer on all the profitability parameters. It maintains the highest operating profit margin (OPM %) at average 31.91%, net profit margin (NPM %) 21.75%, ROE 26.4%, ROCE 25.06% and ROA 19.88% on average basis from FY 2012 to FY 2016.
2. Dr. Reddys Lab stood the second position on all parameters except ROA. It’s average operating profit margin (26.26%) net profit margin (15.68%), ROE (15.6%) and ROCE (14.39%) were just behind that of Lupin while on ROA (10.12%) basis it was on third position.
3. Sun Pharmaceutical was the least performer on all the profitability parameters used in our study. It’s average OPM%, NPM%, ROE, ROCE and ROA were 17.13%, -13.79%, 5.63%, -2.08% and -0.67% respectively during FY2012 to FY 2016.
4. In the area of operating profit margin (OPM%), Lupin stood first at average 31.91% followed by Dr. Reddys (26.26%), Aurobindo Pharma (24.71%), Cipla (23.52%) and Sun Pharma (17.13%) during FY 2012 to FY 2016.
5. Among the top five leading Pharmaceutical companies in India Lupin maintains the highest net profit margin (NPM%) at average 21.75% followed by Dr. Reddys (15.68%), Cipla (14.51%), Aurobindo Pharma (9.54%), and Sun Pharma (-13.79%) during FY 2012 to FY 2016.
6. On return on equity (ROE) measure, Lupin was at the top at average 26.45% followed by Dr. Reddys (15.60%), Aurobindo Pharma (15.30%), Cipla (13.53%) and Sun Pharma (5.63%) during FY 2012 to FY 2016.
7. In the area of return on capital employed, Lupin maintains highest ROCE at average 25.06% among top five pharmaceutical companies in India while remaining companies Dr. Reddys (14.39%), Cipla (12.98%), Aurobindo Pharma (12.59%) and Sun Pharma (-2.08%) are far behind it. Thus Lupin is efficiently utilizing its capital.
8. During the period of study the highest return on assets (ROA) was observed in Lupin at average 19.88% followed by Cipla (10.57%), Dr. Reddys (10.12%), Aurobindo Pharma (9.98%) and Sun Pharma (-0.67%).
CONCLUSION:
Lupin among the top five Indian pharmaceutical companies selected for the study maintains highest score at every parameter of profitability analysis measures used. It secured 1st position based on ultimate ranking in our study with operating profit margin (OPM) at average 31.91%, Net profit margin 21.75%, ROE 26.4%, ROCE 25.06% and ROA 19.88% during last five years performance. On the other hand, Sun Pharma among selected pharmaceutical companies maintains least score at every parameter of profitability, It secured overall 5th position in our study based on ultimate ranking with operating profit margin (OPM) at average 17.13%, Net profit margin -13.71%, ROE 5.63%, ROCE -2.08% and ROA -0.67% during last five years performance. The current study shows Indian pharmaceutical companies selected for the study are doing well on account of profitability measures; however Sun Pharma could not deliver good numbers in recent years for which further study is required. Lupin posted outstanding numbers during last five years and is far ahead of its competitors by securing 1st rank in our study. Dr. Reddys Lab, Cipla and Aurobindo Pharma based on ultimate rank though far behind of Lupin secured 2nd, 3rd and 4th position respectively. However, the profitability performance of Sun Pharma with 5th ultimate rank has been posting consistently poor numbers among top five pharmaceutical companies in the India.
ACKNOWLEDGEMENT
Author acknowledges the immense help received from the scholars whose articles are cited and included in references of this manuscript. The author is also grateful to authors / editors / publishers of all those articles, journals and books from where the literature for this article has been reviewed and discussed.
References:
- Annual reports of Sun Pharmaceuticals, Lupin, Dr. Reddys Lab, Cipla and Aurobindo Pharma,for the year 2012 to 2016, retrieved from their official websites.
- Singh, Vineet and Srivastava, Abhinna, (2015) Receivables Management in Leading Heavy Electrical Industries in India, International Journal of Management, 6(4), 2015, pp. 1 - 8.
- F. Arditti, (1967), “Risk and the Required Return on Equity”, ‘The Journal of Finance’, VOL. 22, No. 1, p. 19-36.
- Vineet Singh. Significance of Working Capital Turnover Ratio: A Case Study of BHEL and Crompton Greaves, International Journal of Management, 6(3), 2015, pp.
1 – 7.
- G. Bharathi Kamath, (2008), "Intellectual capital and corporate performance in Indian pharmaceutical industry", Journal of Intellectual Capital, Vol. 9 Issue: 4, ISSN: 1469-1930, Emerald Group Publishing Limited, pp.684 – 704.
- Srivastava, Abhinna (2016), ‘Opportunities and Threats of Mega Merger: A Case Study of Sun Pharmaceuticals and Ranbaxy Laboratories’, International Journal of Commerce and Management Research, ISSN: 2455-1627, Volume 2; Issue 8; August 2016; Page No. 112-115.
- Srivastava, Abhinna (2016), ‘An Empirical Analysis on Inter Firm Profitability of IT Sector In India’, Abhinav National Monthly Refereed Journal of Research in Commerce & Management, Volume 5, Issue 10 (October, 2016), ISSN-2277-1166.
- ‘Annual reports’, Official website of NSE India; retrieved on 15th September, 2016 from; https://www.nseindia.com/
- ‘Annual reports’, Official website of BSE India; retrieved on 15th September, 2016 from; www.bseindia.com/
- Official website of Money n Business; retrieved on 20th September, 2016 from; http://www.moneynbusiness.com/
- ‘Pharmaceutical industry in India’: Retrieved on 25th September, 2016 from; https://en.wikipedia.org/wiki/Pharmaceutical_industry_in_India
- ‘India Pharma Inc.: Capitalising on India’s Growth Potential’, Retrieved on 17th September, 2016 from; https://www.pwc.in/assets/pdfs/publications 2011/pwc_cii_pharma_summit_report_22nov.pdf
- ‘Indian Pharmaceutical Industries’: Retrieved on 15th September, 2016 from; http://www.ibef.org/industry/pharmaceutical-india.aspx
- IBEF 2016; Indian Pharmaceuticals Industry Analysis, retrieved on 15th September, 2016 from; http://www.ibef.org/industry/indian-pharmaceuticals-industry-analysis-presentation
- Moneycontrol financial; retrieved from; http://www.moneycontrol.com/
- Yahoo finance; retrieved on 15th September, 2016 from; https://in.finance.yahoo.com/
|
 IJCRR
IJCRR 


 This work is licensed under a Creative Commons Attribution-NonCommercial 4.0 International License